Why I Stopped Expecting a Big Crash?
On a log scale, the S&P 500 looks a lot more linear than the headlines suggest. Here's what that tells me, and what it doesn't.
For the past six months, I expected a big crash to be just around the corner. We keep hearing the same warnings: earnings are stretched, valuations are high, and the S&P 500 is more concentrated in a handful of big tech companies than ever. But when I looked at the history, the picture looked quite different.
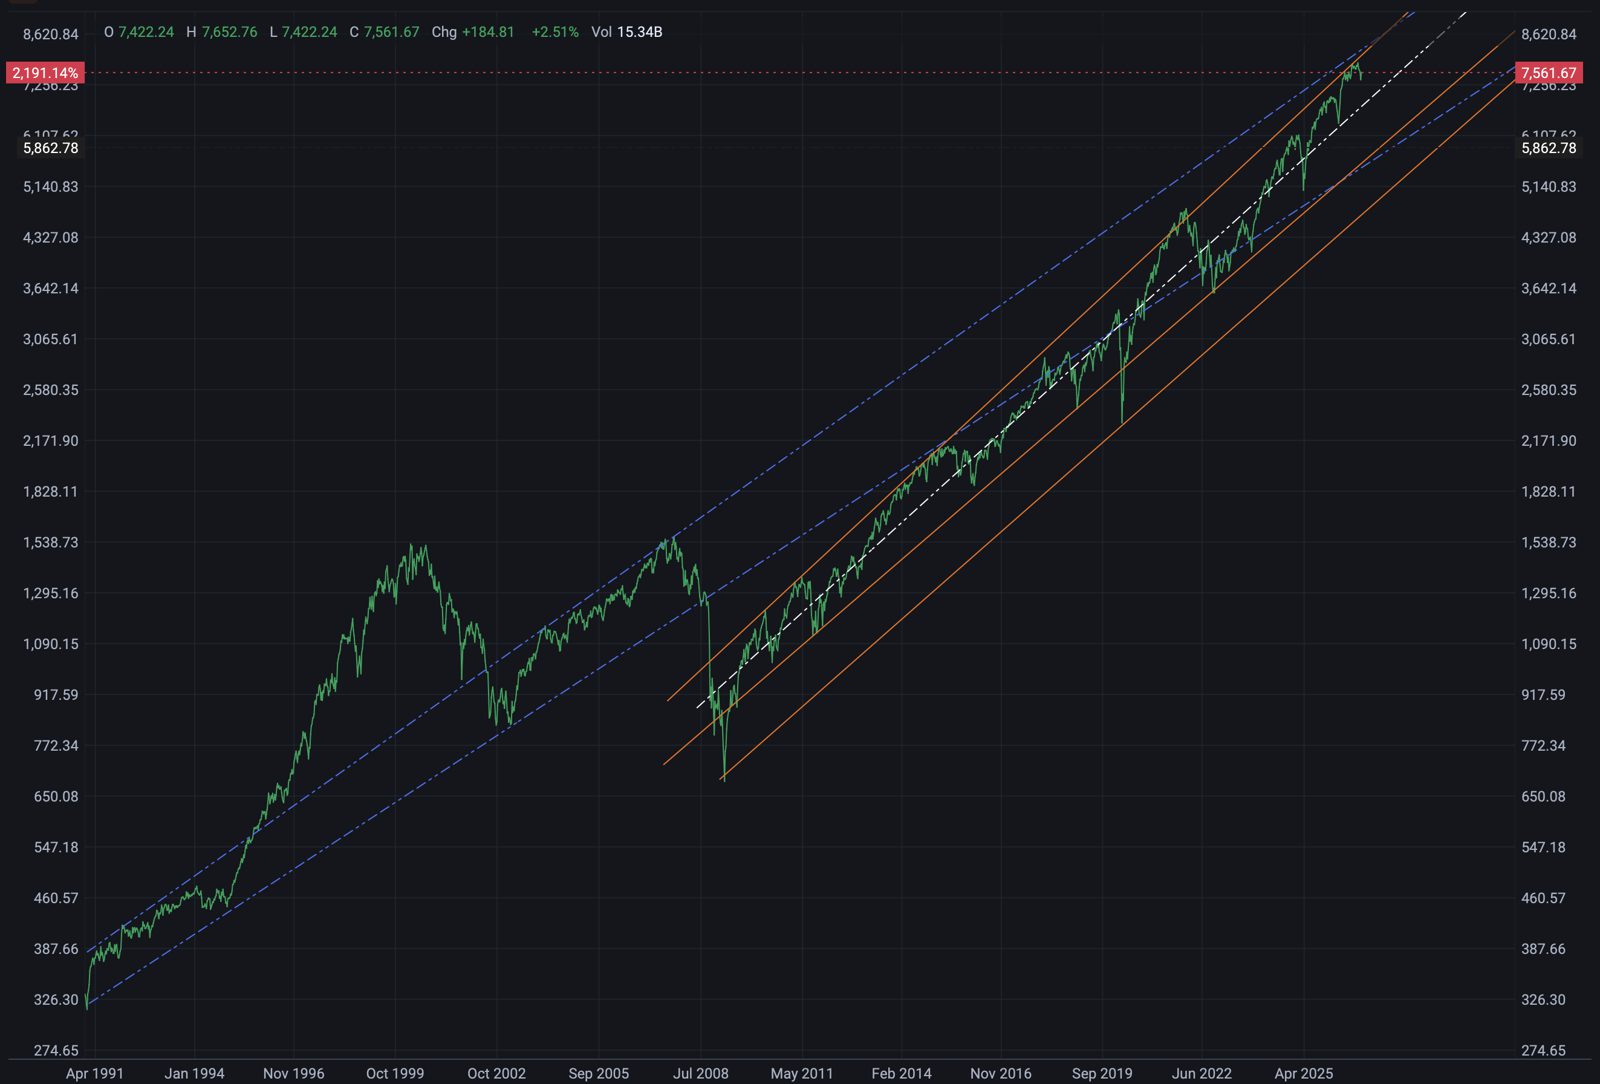
The chart above is the S&P 500 since 1991, on a log scale. That’s something I learned only recently, and it changed how I look at markets. On a normal chart, a 10% move at today’s levels looks enormous next to a 10% move in the 1990s. On a log scale, equal percentage moves look the same size, so you can finally compare different decades fairly. And for long-term growth, the log scale is really all that matters.
Seen this way, the market looks surprisingly linear. The blue lines show the channel it followed from the early 1990s through 2008. The orange lines show the channel it has followed since the 2009 low, with the white line through the middle. Even the big drops, like 2008, 2020 and 2022, look like dips that the index recovered from, returning to its trend instead of breaking it.
That gives me a simple way to think about bubbles. Instead of reacting to every headline, I can check whether the market is still following its trendline. If it’s running far above it, that’s a warning sign. If it’s moving along it, the growth may be less of a bubble than it sounds.
Why a crash is unlikely
Because of these lines. Over the last three decades, the market has kept coming back to its long-term trend, through recessions, crises and a pandemic. Today’s level is still inside the channel, not breaking out far above it.
That said, we are on the higher side of the channel right now, close to its upper edge. If the pattern holds, I’d expect the market to come down from here, back toward the middle of the channel. To me, that looks more like a pullback than a crash.
There’s another detail worth noticing: near today’s high, the orange and blue lines meet. The faster channel since 2009 has caught up with the slower, longer-term one. That could mean the market has been growing faster than its long-run average, and that growth may slow down from here.
Why a crash is still possible
Because this chart doesn’t show what came before. It starts in 1991, and the trend before that was very different. A pattern that held for thirty years is not a law of nature, and markets have gone through long stretches where the trend broke or flattened for years.
So I haven’t stopped believing a crash can happen. I’ve just stopped assuming one is coming, simply because the headlines say so.
I’ll leave the rest of the analysis to you. Take a look at the chart and draw your own lines.
This is my personal view, not financial advice.